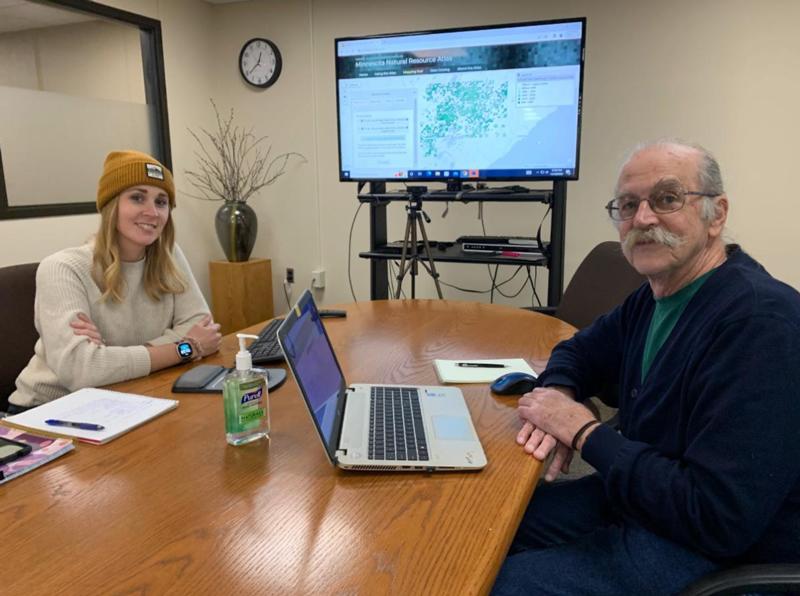
Weekly ATV rides through the Cloquet Valley State Forest inspired a new quest for retired geologist, Peter Jongewaard. As he and his friends in the Reed’s Riders ATV group explored this 366,000 acre forest, he wondered about the early loggers on this land – when they came and what they found.
So, he started digging into the archives in the Gale Library at the Minnesota Historical Society in St. Paul.
Jongewaard was surprised to learn about when and how much of this forest was cut for industry. Now, NRRI is helping him share the reams of data he collected, by converting his spreadsheets into online maps.
“I’ve always been a map guy,” said Jongewaard. “I was the kid in the back seat on family road trips with the map on my lap.”
The project was turned over to NRRI Geographical Information Systems Intern, Megan Quade. She was very impressed by the massive amounts of data Jongewaard collected from a dozen research trips to St. Paul. He went through stacks of land records going back to the 1880’s, when Cloquet-based sawmills began logging in the area.
And then he entered the data he wanted – land ownership, original stand estimates, logging harvest information, dates and details – into a spreadsheet that ended up 9,217 lines long.
“It took some critical thinking on my part to figure out how to join the data into GIS format,” said Quade. “After that, it was just a matter of cleaning up the data, generating symbology, creating static maps, and prepping the data to be shared on the Atlas.”
The tricky part was figuring out how to create a unique ID in both the historic pine spreadsheet and public land survey GIS dataset that could be used to join the datasets. In the end, Quade was able to concatenate (link together in a chain or series) township, range, quarter section, and quarter-quarter sections.
Luckily, the GIS software does this. Quade estimates the entire project took her less than 20 hours to complete.
Now, color-coded tiny, mapped squares in the Cloquet Valley State Forest boundaries show which companies harvested, total estimated board feet cut from different sections, tree species cut – white and red pine– and the “last cut” date. The state forest was established in 1931. Quade also acquired historic logging railroad data from a UMD adjunct professor and added that layer to the static maps which clearly shows how important access to rail was to logging.
Jongewaard donated all of his data to the Minnesota Natural Resource Atlas, a free, online tool developed at NRRI that makes GIS data easily accessible to all. The maps might inform forestry professionals who want to study the evolution of the forest after original harvest, to inform future harvests or replantings.
Or, provide interesting trivia to a ride through the forest.
“Now when I’m ATVing with my friends, I can tell them how many board feet were cut from an area in 1921, and we can put an actual date to the big pine stumps we find,” Jongewaard laughed.
Quade also gave Jongewaard a tutorial on how to use the Atlas so he can use it to analyze and share his data. MNAtlas.org allows him to access the GIS data without needing special software or having prior GIS experience.
“Megan did a fantastic job of making these data visible to the public in the Atlas,” said Jongewaard.
And as an intern, the project gave Quade experience in working with a client’s data, not her own. She will graduate from UMD in December with dual majors, one in Environment, Sustainability and Geography and a second in Geographical Information Systems.
“I had to keep the communications open, emails back and forth and compromise on format,” she said. “Peter did an amazing amount of work pulling this all together and now it’s easy to see and use it.”
