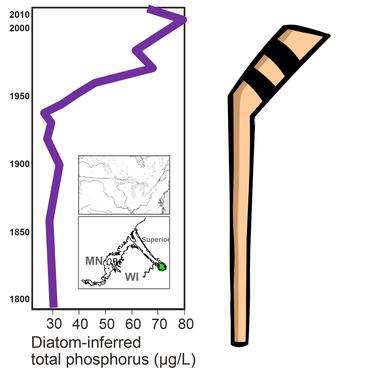
Once you see the hockey stick, you can’t unsee it.
The infamous “hockey stick graph” shows the dramatic rise in global temperatures in the 20th century. From 1000 to about 1900, temps remain relatively flat, even trending down a bit (the hockey stick ‘shaft’). Then it dramatically shoots up (the ‘blade’) to present day.
Since the original graph was first developed in the late 1990s, it’s been replicated many times across diverse fields of study. And now that “hockey stick” is showing up in Euan Reavie’s research.
“Every time we collect a sediment core, we’re analyzing diatom algae or chemicals or organic material, we keep seeing that same hockey stick,” said Reavie, NRRI senior research associate in the Water Group. “It’s a warning signal that things we care a lot about are changing rapidly.”
In a paper published online in August in the journal Lake and Reservoir Management, Reavie promotes a tool that’s not often used to understand contemporary environmental problems – paleolimnology. Paleo means old or ancient; limnology is the study of fresh water.
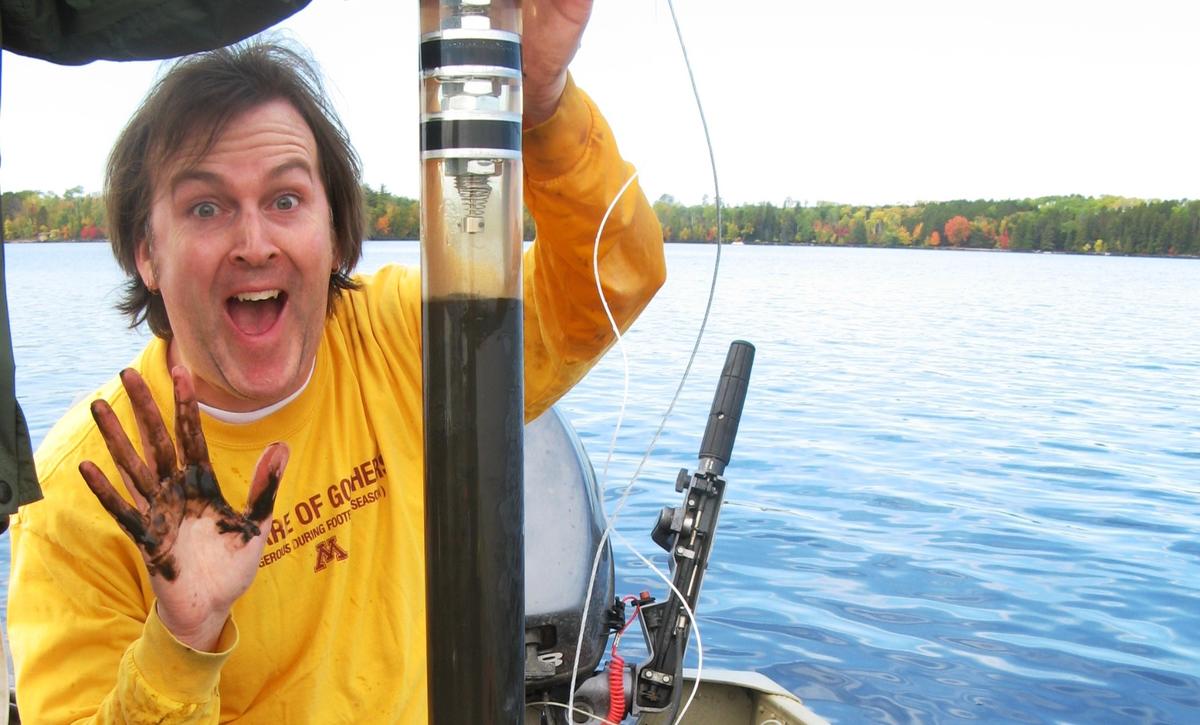
By pulling up a long tube of sediment that has settled on the bottom of a water body over hundreds of years, Reavie and his team can sift through the muck for tiny algae fossils and document environmental changes over time. It’s a technique used often to go back hundreds or thousands of years to understand the history of a water system. But Reavie is seeing the dramatic upward swing of the graph in changes to the biology, chemistry and physics of lakes.
The first example of this surprised him. While gathering data to support removing the St. Louis River Estuary from the national Area of Concern list, the sediment record showed new problems messing up the water.
“The main stem of the estuary is much better now and the nutrient pollution targets set in the 1980s were met,” Reavie said. “But near shore, the story isn’t so great.” New concerns are legacy phosphorous in the sediment, heavier storms and climate change impacts that weren’t identified as problems in the 1980s.
In another example, data collected from a core on Lake Kabetogama in northern St. Louis County showed an abundance of an invasive critter, the spiny water flea that goes back in the mid-20th century but wasn’t detected in monitoring data until 15 years ago. Yet another hockey stick.
His third example is found in diatom algae fossils collected in the Great Lakes that shows a recent rise in species that should only be found in warmer lakes with shorter ice-cover seasons. Recent warming temperatures have apparently reorganized the biology of these historically cold lakes, like Lake Superior.
“Seeing the data shooting up on the graphs and quantifying how quickly things are changing, that’s an early warning signal,” said Reavie. “This allows us to project what the future might look like so we can take action today.”

